
Amazon IPI Score: What It Is and How to Improve It
Learn what the Amazon IPI score measures, what drives it, and how to improve it with concrete inventory actions that protect capacity and margins.

The Amazon IPI score is a 0-to-1000 rolling metric driven by excess inventory, sell-through, stranded inventory, and in-stock availability. It influences FBA storage and capacity, but it isn't a universal threshold sellers should target, especially when an inbound shipment is ready and available capacity looks unexpectedly tight.
A seller opening Seller Central may see a disappointing score even though the warehouse holds products customers still want. The useful question isn't whether that number is high enough. It's which ASINs have too much coverage, which listings can't accept orders, and which replenishment plans no longer match demand.
Table of Contents
- What the Amazon IPI Score Measures
- The Four Conditions Behind the Amazon IPI Score
- How Amazon Reads Your IPI Score and Capacity Decisions
- Excess and Stranded Inventory on the IPI Dashboard
- How to Improve Your Amazon IPI Score Operationally
- Why the 'Target 450' Advice Often Misleads Sellers
- Acting on Amazon IPI Score Data Through an Agent Workflow
What the Amazon IPI Score Measures
A seller opens the Inventory Performance dashboard the week before a planned replenishment. The account-level score has slipped, yet her two fastest ASINs are days from stocking out while a third sits on months of coverage. The number alone cannot tell her which of those problems deserves attention first.
The Inventory Performance Index, or IPI, is Amazon's rolling summary of how efficiently a seller converts FBA storage into sales. Amazon evaluates the relationship between inventory held, expected customer demand, listing availability, and stock that occupies space without being buyable, per Amazon's Inventory Performance Index documentation.
Read the score as a classification system rather than a verdict. It works like the summary line on a financial statement: it reports the health of the whole account at a glance, while the underlying entries show where to act. For inventory, those entries are per-ASIN days of supply, stranded unit counts, and projected excess units. Sending less stock helps only until customers can no longer buy a replenishable product. Sending more helps only until the extra units exceed plausible demand.
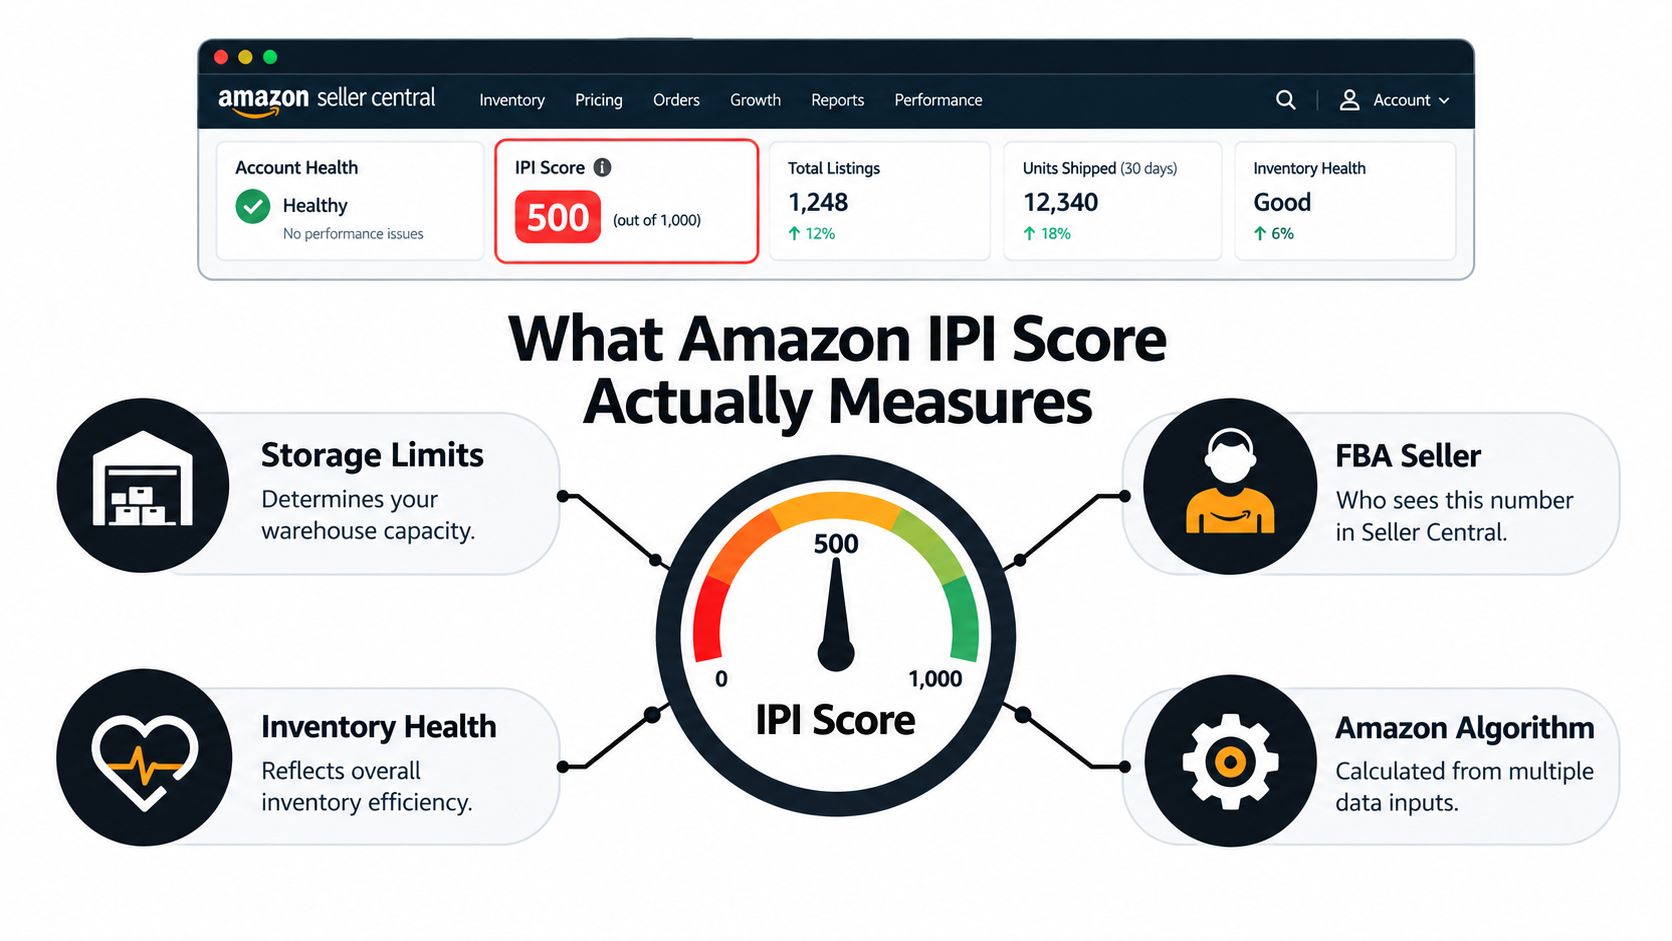
The score and the capacity limit answer different questions
The score describes inventory performance over a rolling period. The capacity limit describes how much storage Amazon makes available under the applicable account and marketplace conditions.
A seller can tighten inventory operations without receiving an immediate increase in permitted storage. Unused space under an existing limit says nothing about how Amazon will evaluate the next planning period. The infographic's storage-limit connection should therefore be read as an influence on capacity rather than a guarantee that the score alone determines warehouse space.
Practical rule: Diagnose inventory at the ASIN level, then use IPI to monitor the broader result. Working backward from a desired score can obscure the real inventory problem.
Inventory health sits apart from inventory economics
An operator should keep separate records for inventory performance, expected holding costs, and capacity planning. These records inform related decisions, but they answer different questions.
- Inventory performance: Is stock moving and available for purchase?
- Inventory economics: Does holding an ASIN still make financial sense?
- Capacity planning: Can planned receipts fit within the applicable limits?
Consider an active product with steady sales alongside an inactive listing whose units already sit in FBA. Both occupy warehouse space, but they need different interventions. The active product calls for demand and coverage analysis. The inactive listing calls for a catalog investigation before anyone concludes customers lost interest.
That distinction is the foundation of useful IPI work. The account-level number flags a concern; the per-ASIN records reveal the mechanism an operator can fix today.
The Four Conditions Behind the Amazon IPI Score
Amazon's IPI framework considers excess or aged inventory, rolling sell-through, stranded inventory, and stock availability. Its documentation defines excess inventory using more than 90 days of projected supply and calculates FBA sell-through as units shipped during the previous 90 days divided by average units held during that period, making demand, inventory coverage, and availability central to diagnosis (Amazon's IPI definitions and calculation guidance).
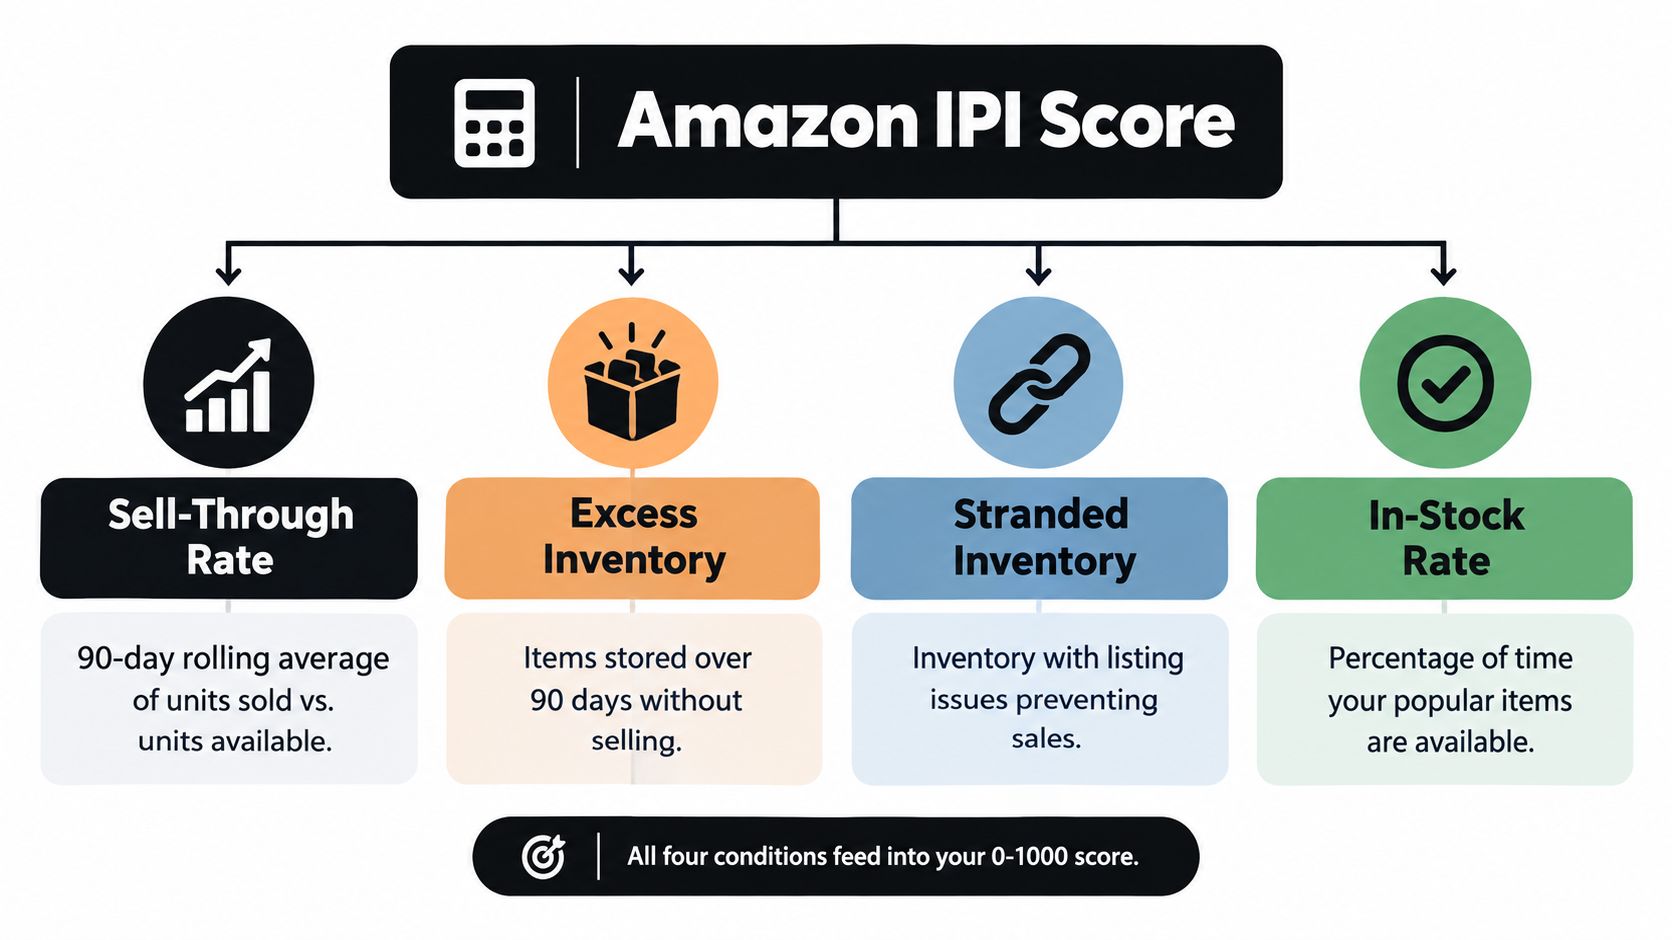
The diagram is a simplified overview. Its excess-inventory label shouldn't be interpreted as a rule based solely on how long a unit has sat in storage. Projected supply depends on forecasted demand, not just inventory age.
Sell-through and excess describe different relationships
Sell-through compares shipments with inventory held over the measurement period. An operator can improve that relationship by generating profitable shipments or reducing unnecessary inventory, provided availability doesn't deteriorate.
A large receipt can increase inventory held before sales catch up. That doesn't prove the product is failing, but it makes the timing and size of replenishment relevant to the calculation. Conversely, removing inventory doesn't retroactively erase the stock held earlier in the rolling period.
Excess exposure concerns how much stock remains relative to expected demand. A seasonal product may need a different replenishment plan from a stable replenishable item, even when their current on-hand quantities look similar.
Stranded stock isn't evidence of weak demand
A stranded ASIN can have customer demand but no purchasable offer. Treating its suppressed shipments as a demand signal would confuse a listing problem with a merchandising problem.
The availability condition also requires careful interpretation. An operator shouldn't label every unit that isn't immediately purchasable as stranded without checking Amazon's source-provided classification.
| Condition | Question for the operator | Mistake to avoid |
|---|---|---|
| Excess inventory | Does projected demand justify this coverage? | Using inventory age alone |
| Sell-through | Are shipments proportionate to inventory held? | Looking only at sales growth |
| Stranded inventory | Is an inactive listing preventing purchases? | Increasing advertising before fixing availability |
| In-stock availability | Can customers buy the products being replenished? | Cutting inventory indiscriminately |
A practical diagnosis follows the sequence availability, demand, coverage, economics. First establish whether the offer can sell. Then assess whether the forecast supports the stock position and whether holding the remaining units is economically defensible.
How Amazon Reads Your IPI Score and Capacity Decisions
Capacity planning starts with Amazon's announced limits and check weeks, not a score remembered from a seller forum. Professional-account decisions combine IPI with ASIN sales forecasts, shipment lead time, fulfillment-center capacity, sales volume, and historical IPI; Amazon also describes a quarterly storage-limit evaluation cycle with notifications four to eight weeks before a new period (Amazon's capacity-policy announcement).
Those inputs explain why sellers with similar scores can face different planning constraints. Amazon isn't evaluating the score in isolation.
How IPI Inputs Combine Into Storage Limits
| Input | Seller-controlled | Why it matters for capacity |
|---|---|---|
| IPI performance | Partly | Reflects inventory conditions affected by replenishment, availability, and excess |
| ASIN sales forecasts | Partly | Connects expected demand with future inventory requirements |
| Shipment lead time | Partly | Changes when inventory must enter the fulfillment network |
| Fulfillment-center capacity | No | Limits depend partly on available network space |
| Sales volume | Partly | Provides context for the account's inventory requirements |
| Historical IPI | Not retroactively | Past performance remains relevant after current operations improve |
| Inventory coverage and seasonality | Partly | Changes the relationship between current stock and upcoming demand |
Read capacity alongside the inbound plan
The operator's working view should separate standard-size and oversize capacity, applicable limits, utilization percentage, expected receipts, and shipment lead time. Combining them into a single storage total can conceal a constraint in a particular category.
A fast-moving assortment with short replenishment lead times may need less coverage between receipts. An assortment with longer lead times may require earlier commitments and more careful receipt scheduling. These are planning differences, not evidence that either seller deserves a particular capacity allocation.
A low utilization percentage isn't a promise that the next inbound plan will fit. Future receipts and the applicable capacity period still need to be reconciled.
An announced check week should trigger a review of facts already affecting the account: unresolved listing problems, projected excess, scheduled receipts, and purchase commitments. It shouldn't trigger indiscriminate removals merely to make a dashboard look better.
For agencies, this means keeping each seller's marketplace, planning period, and capacity category attached to the analysis. Comparing scores across accounts without that context creates a misleading benchmark.
The operational deliverable is a receipt plan that fits the announced constraints, with alternatives reviewed before commitments become difficult to change.
Excess and Stranded Inventory on the IPI Dashboard
Excess inventory is a forecast-and-economics classification. Amazon's dashboard reports both the percentage of FBA units classified as excess and excess units for which continued storage is estimated to cost more than an action such as markdown or removal; its estimate includes projected monthly and long-term storage charges over three years, product costs, and applicable fees (Amazon's excess-inventory definitions).
That estimate is a comparison of possible outcomes, not a bill already incurred. It gives the operator a reason to investigate the ASIN, but it doesn't remove the need to check forecast assumptions and the commercial consequences of an intervention.
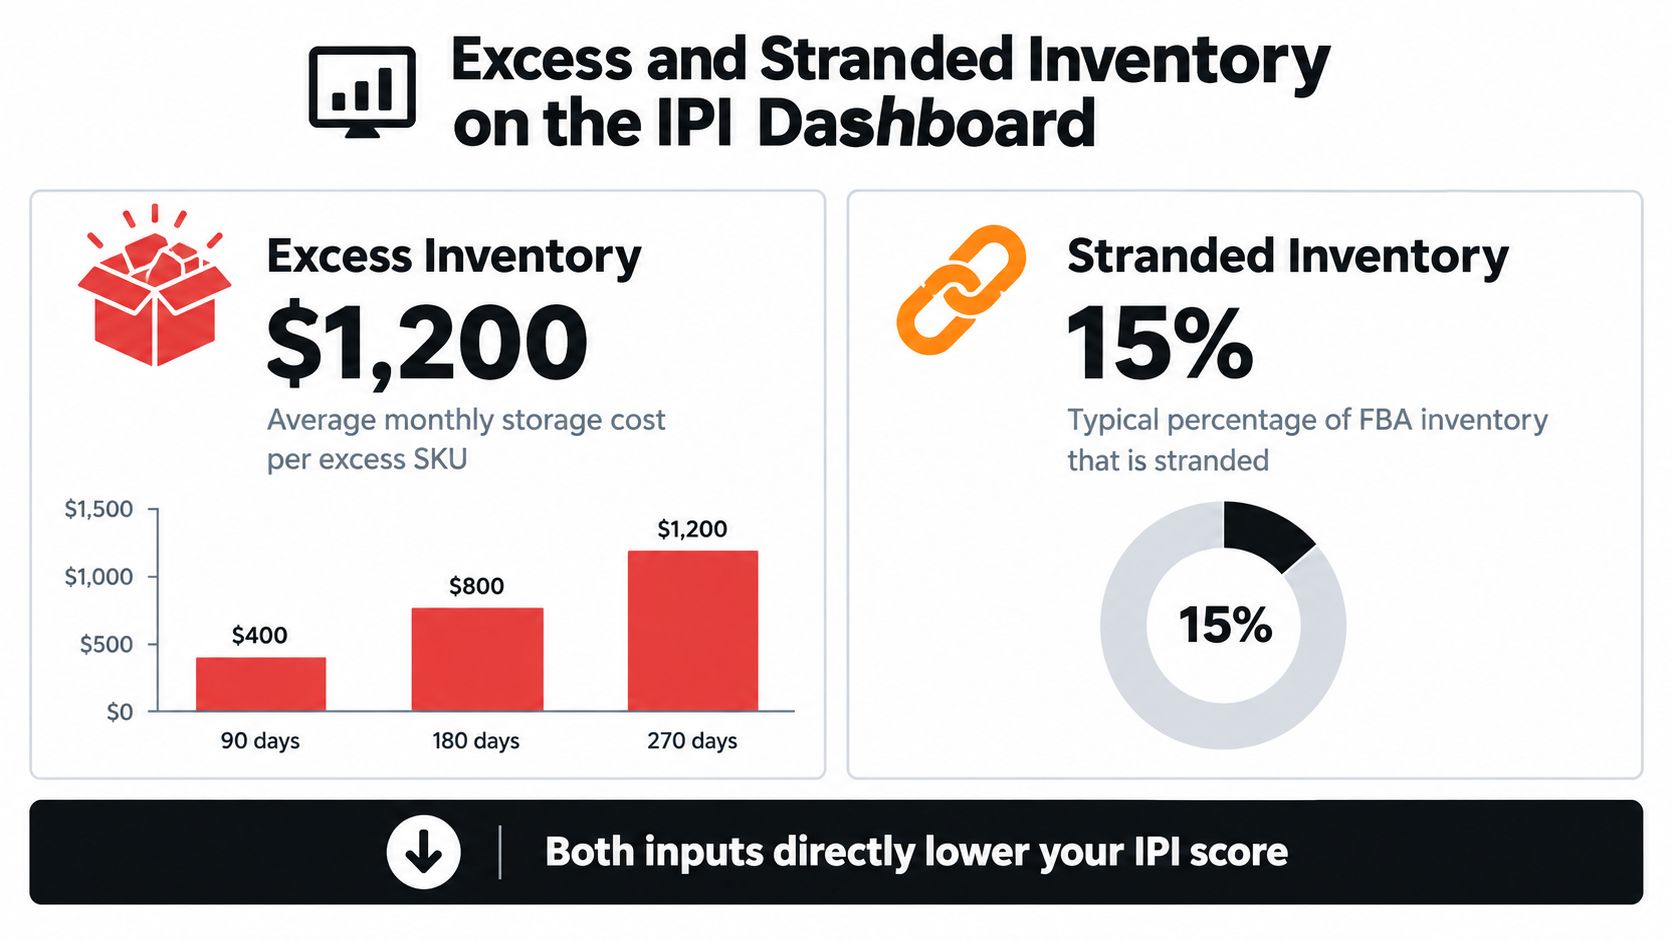
The infographic's example amounts and percentages aren't operational benchmarks. Sellers should use their own account records and Amazon's current estimates rather than treating those visual figures as typical costs or prevalence.
Read the percentage and unit count together
A percentage describes the share of inventory affected. A unit count describes the physical stock requiring investigation. Neither independently establishes the financial priority.
A useful excess review combines:
- Forecast context: Whether expected demand still reflects the product's selling season.
- Economic exposure: Amazon's estimated holding costs alongside margin and action costs.
- Receipt commitments: Whether pending replenishment would recreate the same excess.
- Availability: Whether the listing can currently generate sales.
The broader inventory-cost reduction workflow belongs beside this review because reducing a classification isn't enough if the chosen action worsens the economics.
Stranded inventory needs a different investigation
Amazon defines stranded units as FBA units without an active listing and stranded inventory percentage as the share currently unavailable for purchase; inventory that incurs storage fees without a possibility of sale can reduce IPI (Amazon's stranded-inventory guidance).
That makes listing health an inventory responsibility, not merely a catalog responsibility. An operator should record the listing issue, the affected units, the person responsible for resolution, and whether restoring the offer is feasible.
A product that sells poorly while active needs demand analysis. A product that can't be purchased needs an availability investigation first.
Priority should follow the cause and recoverable value, not the largest warning badge. Restoring a viable listing and removing commercially unviable stock are different decisions, even when both improve the inventory position.
How to Improve Your Amazon IPI Score Operationally
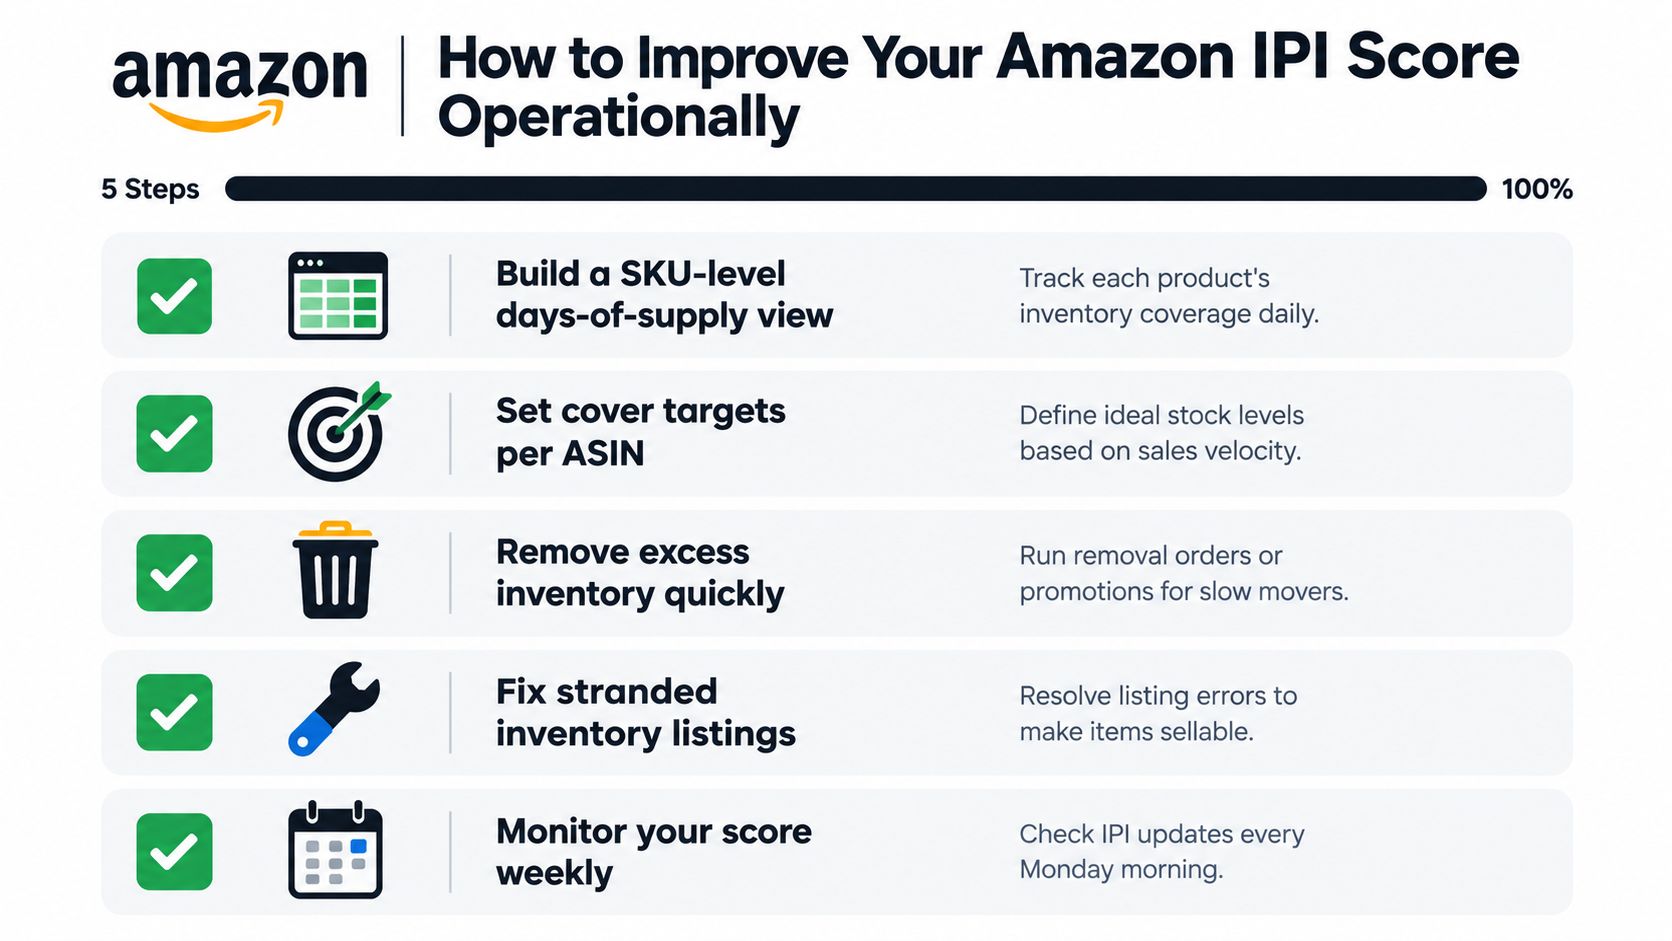
A seller sees excess flags across the dashboard and halves every inbound shipment. Two weeks later the best sellers are stocked out while the slow movers still sit overstocked. The score barely moved, and revenue absorbed the damage. Improvement works at the ASIN level, so the workflow starts with a per-ASIN inventory worksheet where each row connects stock held, expected demand, listing availability, and planned receipts.
The working fields should include days of supply, shipped units, average on-hand units, stranded units, projected excess units, inbound quantities, and lead time. Record source timestamps beside the values so an operator never mistakes an older report for the current position.
Set coverage targets around the ASIN
The Amazon calculation guidance cited earlier frames coverage as roughly 30–60 days of expected demand, and a practical target should adjust that range for seasonality, lead time, and forecast volatility.
That range is a starting hypothesis applied one ASIN at a time. A seasonal product heading into peak needs different coverage than a steady seller with a short supplier lead time. Document why each ASIN carries its chosen coverage and when that assumption should be reconsidered.
For teams coordinating supplier orders, warehouse stock, and FBA receipts, Supply Automate's guide to ERP for marketplace sellers provides relevant system-planning context. The control that matters is reconciling purchase commitments with the same demand assumptions used for FBA replenishment.
Match the action to the mechanism
Each flag on the dashboard points to a different mechanism, and each mechanism has a different fix.
A stranded listing needs a listing fix. Advertising changes won't restore an offer customers can't purchase. Verify the correction restored availability before evaluating subsequent sales.
An active, overstocked ASIN needs an economic comparison. Price changes, merchandising, targeted advertising, removal, or reduced replenishment should be weighed against margin, expected demand, and the cost of continued holding. An excess label alone doesn't justify more ad spend.
An undercovered replenishable ASIN needs an availability plan. Cutting inbound quantities across the board makes inventory totals look healthier while creating avoidable stockouts on products that sell.
Decision discipline: Compare the expected outcome of each intervention before execution. A lower stock balance isn't automatically a better commercial result.
Review the operating controls weekly
- Listing exceptions: Assign unresolved stranded ASINs to a named owner.
- Coverage changes: Investigate forecast shifts and unexpectedly large receipts.
- Excess exposure: Review projected excess alongside pending purchase orders.
- Advertising economics: Check whether incremental demand justifies the spend.
- Capacity constraints: Reconcile planned receipts with the applicable category and period.
- Completed changes: Verify outcomes rather than treating submission as completion.
The Amazon inventory management workflow connects these checks to replenishment decisions. Without that connection, an operator clears existing excess while the purchasing process keeps creating more.
Why the 'Target 450' Advice Often Misleads Sellers
450 isn't a permanent global promise of unrestricted capacity. Historical Amazon announcements have referenced a 400 storage-limit threshold and advice to maintain a score above 450, but those historical figures shouldn't replace the threshold and check weeks shown for the seller's current marketplace and planning period.
The distinction matters because a threshold is a policy input, not a complete explanation of capacity. A seller following an old benchmark can make an apparently reasonable inventory decision against the wrong planning assumptions.
A higher score doesn't guarantee a specific limit
Amazon states that capacity depends on IPI plus sales forecasts, shipment lead time, fulfillment-center capacity, inventory coverage, seasonality, and excess-inventory levels; limits are updated quarterly, and an improved score may raise capacity without guaranteeing a specific allocation (Amazon's capacity-limit factors and evaluation guidance).
The seller therefore needs separate evidence for two conclusions: whether inventory performance improved, and whether Amazon changed the applicable capacity. The former doesn't establish the latter.
A passing benchmark isn't an inbound plan. Receipt timing, product mix, and the applicable capacity category still need operational review.
Plan seasonal receipts before the constraint becomes urgent
An operator preparing for a seasonal peak should map expected demand against inventory already held, committed purchases, inbound lead time, and announced capacity. That exercise remains necessary even when the score looks comfortable.
A useful decision record separates the following questions:
- Current performance: Which underlying inventory conditions changed?
- Applicable policy: Which threshold and check weeks appear in Seller Central?
- Receipt feasibility: Which planned shipments fit the relevant period and capacity category?
- Contingency: Which commitments can be reduced or rescheduled if assumptions change?
This approach also prevents a common analytical error: interpreting every capacity disappointment as evidence that the inventory cleanup failed. A successful listing repair or sensible replenishment reduction can still be valuable without producing an immediate capacity increase.
The better target is commercially justified inventory within verified constraints. The score remains important, but operators shouldn't substitute it for a demand forecast or a receipt schedule.
Acting on Amazon IPI Score Data Through an Agent Workflow
An agent workflow needs per-ASIN coverage, shipped units, average inventory, stranded units, projected excess, and announced check weeks. Amazon report availability and source timestamps should remain explicit; a workflow shouldn't imply that every Seller Central field is available through every SP-API report.
Agent Central is a hosted MCP server connecting Claude, ChatGPT, OpenClaw, Cursor, and other MCP clients to Seller Central and Amazon Ads, including inventory, orders, catalog, ranking, finance, and fulfillment data. It returns facts, source-provided metrics, classifications, and guarded write tools, not recommendations.
Keep analysis separate from execution
- Read: Retrieve available inventory and advertising records through authorized, scoped access.
- Evaluate: Let the operator's agent compare listing, demand, and coverage conditions.
- Preview: Review supported writes before execution, with duplicate-submission protection and audit logs.
Data syncs on a schedule. A new account starts with 30 days of history, which builds from there; Amazon Ads history remains while connected. This doesn't replace missing historical inputs needed for longer-window calculations.
For broader workflow context, Cyndra's approach to streamline retail operations with AI complements the need for explicit controls. An inventory management automation workflow should likewise preserve operator approval.
Setup involves signing up at the publisher's site, connecting Seller Central and Amazon Ads through Amazon's authorization, then adding the connection using the AI-client quickstart. Plans use monthly Amazon order volume and include a 14-day free trial requiring no card.
The hosted MCP connection gives operators structured Amazon account facts for investigating IPI drivers, with guarded writes and audit logs for supported changes. Sellers and agencies can visit agentcentral to connect their accounts and build an inventory review around per-ASIN availability, coverage, and excess exposure.
Related Agent Central pages
- Amazon seller data for AI agents
How Agent Central normalizes Amazon seller data before exposing it to AI clients.
- Amazon Seller Central MCP server
Canonical hosted MCP overview for Seller Central, Ads, inventory, catalog, finance, and fulfillment data.
- Inventory tool reference
Inventory, orders, sales velocity, listing registry, days of cover, returns, and reimbursements.
- Connect Seller Central to Claude
Step-by-step path from Amazon OAuth to a Claude connector or MCP config.
- ChatGPT with Amazon seller data
ChatGPT-specific setup path for Amazon seller data through hosted MCP.
- Fulfillment tool reference
MCF shipping previews, orders, order creation, tracking, and returns.
Related reading
- What Is an Inventory List? A Guide for Amazon Sellers
What is inventory list. Learn what an inventory list is for Amazon FBA, how to structure fields, and how agents use it via Agent Central
- How to Calculate Inventory Turnover for Amazon
Calculate inventory turnover by aligning seller-owned COGS with inventory value, then use Amazon-side records without confusing unit snapshots with cost data.
- Amazon TACoS: Formula, ACoS vs TACoS and Benchmarks
Amazon TACoS is ad spend divided by total sales. See the formula, worked examples, how it differs from ACoS, and which reports supply each input.
- What Is API Integration and How It Works for Amazon Sellers
Learn what is API integration, how it connects software systems, and why Amazon sellers use MCP servers to access Seller Central, Ads, and fulfillment data
Connect Amazon seller data to your AI client.
Agent Central gives Claude, ChatGPT, OpenClaw, Cursor, and other MCP clients structured access to Amazon Ads, Seller Central, inventory, orders, catalog, finance, and fulfillment data.