
What Is Ecommerce Analytics? Metrics, Sources and Examples
Learn what ecommerce analytics measures, which data sources feed it, and how Amazon sellers use metrics like contribution profit and TACOS to decide.

Ecommerce analytics is the practice of collecting sales, traffic, advertising, cost and customer data and turning it into measurements that explain performance. Using storefront events, Amazon Ads reports, Seller Central records, cost sheets and refunds, it supports budget allocation, replenishment and pricing decisions, including comparisons that account for Amazon's 14-day advertising attribution window.
Why should a team scale its best-ROAS campaign if the products it sells lose money after returns and fees? Sales performance and economic performance aren't interchangeable. For Amazon operators, useful analytics connects the advertising result to the order, the product's costs and the eventual financial outcome.
Table of Contents
- What Is Ecommerce Analytics and Why Does It Matter?
- Which Metrics Matter and What Each One Tells You
- Where Does Ecommerce Data Come From and Why Does It Arrive Late?
- Which Amazon Data Can You Actually Reach and What Limits Apply?
- How to Build an Ecommerce Analytics Workflow
- How to Read Your Conversion Funnel Step by Step
- Which Number Should Guide Your Budget Decisions
- What Should You Do First After Reading This Guide?
What Is Ecommerce Analytics and Why Does It Matter?
How much of last month's revenue survived fees, ad spend, and refunds? Ecommerce analytics answers that class of question: which channel earns money, which products lose money after costs, and whether growth holds up against the same period last year. Website analytics supplies part of the picture. Sessions and page views describe traffic; they say nothing about what an order costs to serve.
A store manager who counts everyone entering the shop but never checks what customers buy or what each sale costs has traffic data without economics. An Amazon team makes the same mistake when it celebrates rising sessions and ordered product sales without checking advertising expense, fulfillment charges and refunds.
Say a seller increases advertising on a bulky product. Orders rise, but nobody has updated freight assumptions or linked subsequent returns to those orders. Amazon also attributes ad conversions over a 14-day window, so ad sales keep accruing to earlier clicks and early ACOS reads artificially high. The campaign can look successful in the advertising report while its contribution profit stays unproven. Scaling spend on that read commits more money to a loser.
Scale needs context, not just a larger sales total
Global business ecommerce expanded rapidly through the pandemic years, then grew more slowly as restrictions and disruptions eased. Reported growth moderated even while transaction volumes remained above their earlier levels. Those figures concern business-to-business trade rather than consumer-only online retail, but the operating lesson transfers directly: slower growth measured against an unusually strong baseline does not by itself establish weakening demand.
For an Amazon seller, the corresponding analysis should separate:
- Volume from price: more revenue does not necessarily mean more units or buyers, since price increases and mix shifts can lift the total while unit counts fall.
- Channel mix from demand: sales moving between channels can change reported growth without changing the underlying business.
- Orders from retained revenue: a completed purchase is not the final economic outcome while refunds remain outstanding.
Teams establishing a broader measurement vocabulary can use ELECTE's practical ecommerce analytics guide as a starting point. The operator's responsibility is to connect that vocabulary to an actual decision, with a defined period, source and cost basis.
Practical rule: Traffic explains access to demand. Orders explain purchasing. Contribution profit establishes whether serving that demand earns money.
Which Metrics Matter and What Each One Tells You
Core ecommerce metrics, formulas and what each one answers
| Metric | Formula | Question it answers | Common trap |
|---|---|---|---|
| Revenue | Sum of order value | How much did the business sell? | Gross figures include refunds unless netted |
| Conversion rate | Orders divided by sessions | Did visitors buy? | Hides where checkout friction occurs |
| Average order value | Revenue divided by orders | Are baskets growing? | Can rise while margin falls |
| Repeat purchase rate | Customers with two or more orders divided by all customers | Are buyers coming back? | Needs a fixed time window to compare periods |
| ROAS | Ad-attributed sales divided by ad spend | Is ad spend returning revenue? | Ignores margin, organic sales and refunds |
| ACOS | Ad spend divided by ad-attributed sales | What share of ad sales goes to advertising? | Inverse of ROAS with the same blind spots |
| TACOS | Ad spend divided by total sales | How much advertising expense supports overall sales? | Needs total sales, not only ad sales |
| Contribution profit | Revenue minus cost of goods, fees, ad spend, refunds and other variable costs | Does the sale contribute money after variable costs? | Requires cost data from several systems |
Express conversion rate, repeat purchase rate, ACOS and TACOS as percentages when presenting them. ROAS is normally a multiple, while contribution profit is a monetary amount. Contribution margin is contribution profit divided by the corresponding revenue.
Revenue and customer metrics require consistent definitions
Revenue needs an explicit policy for discounts, taxes, shipping charges, cancellations and refunds. If revenue is already net of refunds, the contribution calculation must not subtract those refunds again.
Average order value needs the same revenue basis and order population in both periods. It can increase because shoppers buy more products, but it can also increase because a seller discounts an expensive, low-margin bundle.
Repeat purchase rate requires both a fixed observation window and a consistent customer identifier. Comparing an older customer cohort with a recently acquired cohort gives the older group more opportunity to reorder.
Conversion rate also requires care on Amazon. Orders divided by sessions is a useful general definition, but unit session percentage measures units against sessions, not distinct orders against sessions.
Advertising metrics describe efficiency, not earnings
ROAS and ACOS describe the same attributed sales from opposite directions. They're reciprocals when calculated from identical spend, sales, currency and reporting periods, with ACOS converted from its percentage presentation before taking the reciprocal.
Neither measure includes organic sales or product margin. TACOS introduces total sales into the denominator, making advertising expenditure visible against the whole business. It doesn't prove that the remaining sales would have occurred without advertising, or that attributed sales were incremental.
Contribution profit supplies the economic check. Include the relevant product costs, Amazon fees, fulfillment expense, advertising, refund effects and other variable costs without double-counting overlapping categories.
The U.S. Census Bureau's retail ecommerce statistics estimated ecommerce at 16.6% of total U.S. retail sales in the fourth quarter of 2025. That's a market-share measure, not a growth rate, illustrating why the denominator matters as much as the headline total.
For Amazon-specific definitions, the Amazon performance metrics reference helps teams organize their measurement set.
A metric earns its place in a recurring report only when its owner can name the decision it informs.
Where Does Ecommerce Data Come From and Why Does It Arrive Late?
Ecommerce data sources, what they hold and their timing limits
| Source | What it holds | Timing or limit | How to handle it |
|---|---|---|---|
| Site or storefront analytics | Sessions, traffic sources, cart and checkout events | Visibility requires correctly implemented events and permitted collection | Tag every checkout step with the same event names |
| Ad platform reports | Spend, clicks, attributed sales and conversions | Attributed sales can increase while the attribution window remains open | Use closed-window snapshots for settled comparisons |
| Amazon Seller Central reports | Orders, inventory, returns, settlements and listings | Asynchronous report generation means results aren't instant | Match report dates to the chosen order-date basis |
| ERP or cost sheets | Cost of goods, freight and packaging | Updated when purchasing changes | Version the cost sheet by effective date |
| Refund and return records | Refund events, return reasons and reimbursements | Lag the original sale | Link each refund to its original order ID |
Analytics is only as reliable as the records being combined. A settlement describes financial activity, an order report describes purchasing, and an advertising report assigns marketing credit. Their totals shouldn't be expected to match without reconciliation.

Separate generation delay from access gaps
Amazon generates reports asynchronously: the workflow requests a report, checks its processing state and retrieves the result when available. A missing report can also reflect permissions rather than processing delay. Amazon's SP-API role mappings establish operation-specific access, including the Brand Analytics role for Brand Analytics reports.
Agent Central syncs Amazon account data ahead of time on a schedule and serves those records through MCP tools. Answers from synced records reflect the last completed sync, not a real-time account feed. A new account starts with 30 days of history that builds from there, and Amazon Ads history is retained while the account stays connected.
Amazon OAuth tokens are stored encrypted at rest and used only to sync Amazon seller data and perform Amazon API writes requested through the service.
- Preserve provenance: Record the report period, marketplace, currency and retrieval or sync context alongside each result.
- Treat missing values explicitly: An unavailable field isn't a zero, and an authorization failure isn't evidence of no activity.
The Amazon sales data analysis guide provides context for working with these records. When financial reconciliation requires outside support, Book Tech LLC's guide to choosing an ecommerce bookkeeping partner offers a useful evaluation starting point.
Which Amazon Data Can You Actually Reach and What Limits Apply?
A connected Seller Central account doesn't guarantee access to every report family. For a custom integration, the developer must register for SP-API, request the required roles, register the application and select its authorization model.
Amazon's SP-API roles documentation explains that Amazon can approve or deny role requests. After approval of a new role, the developer adds it to the application configuration, relists the application and obtains new seller authorizations so the refresh token carries the expanded permissions.
Authorization follows operations, not account labels
When an operation lists alternative permitted roles, authorization for one listed role can be sufficient. Restricted-data operations typically require both general and restricted access, including workflows for direct-to-consumer shipping, tax invoicing and tax remittance, according to Amazon's restricted-operation role mappings.
For restricted calls involving personally identifiable information, the workflow uses a Restricted Data Token, passed in the x-amz-access-token header instead of the normal Login with Amazon access token. Seller consent alone doesn't remove that requirement.
This explains a common integration discrepancy: orders and inventory may work while a brand-report workflow fails. The connection exists, but the operation's authorization requirement hasn't been met.
Submission success isn't final processing success
Amazon's listing-issues documentation states that a JSON_LISTINGS_FEED processing report includes only synchronous issues by default. Retrieving asynchronous issues requires requesting the issues field through includedData; LISTINGS_ITEM_ISSUES_CHANGE notifications cover later changes.
A guarded workflow should therefore retain:
- Submission evidence: The request reference and initial response.
- Processing evidence: The completed report and returned issues.
- Later state changes: Notifications or subsequent records showing whether issues changed.
The implementation rule is to enumerate inventory, order, finance, catalog, fulfillment and brand-report requirements by API operation and required role. The Seller Central API guide provides an integration-oriented reference.
Agent Central combines Amazon OAuth authorization with scoped API keys. Responses respect the key's account, marketplace, Ads profiles and enabled domains; guarded writes return audit logs. It returns facts rather than recommendations, leaving decisions with the user's agent or team.
How to Build an Ecommerce Analytics Workflow
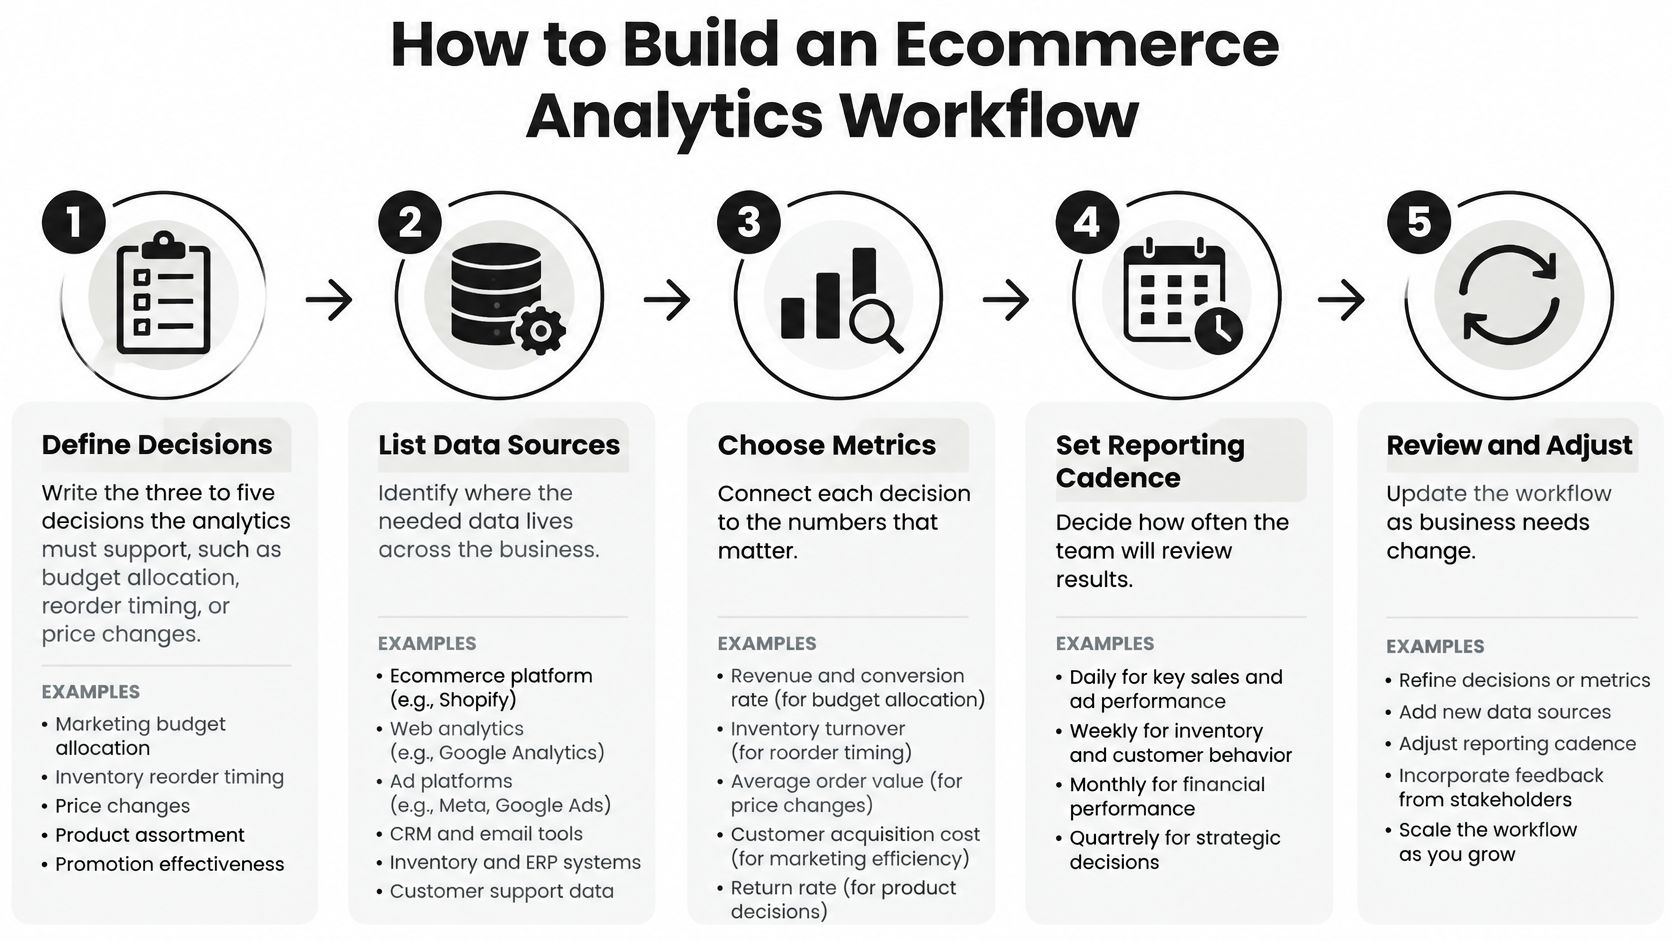
A useful workflow starts with a decision someone can make. Building every possible metric first creates more reconciliation work before the team has established what evidence it needs.
Establish the measurement contract
- Write the decisions before selecting metrics. Start with three to five operating questions, such as budget allocation, reorder timing and price changes. The common slip is building a report around available columns instead of the evidence required for a decision.
- Assign one definition and one owner to each term. Specify whether revenue is gross or net of refunds, how cancellations are treated and which costs belong in contribution profit. Mixing gross revenue in the advertising review with net revenue in the finance review creates disagreement that no visualization can resolve.
- Map every metric to its source and date basis. Record whether the number follows order date, click date, refund date or settlement date, together with marketplace and currency. Use effective-dated costs so a purchasing change doesn't rewrite the economics of earlier orders.
- Write the attribution window beside ad-sales figures. Preserve the campaign type, attribution basis and maturity of the observation period. Comparing a recently opened reporting period with a settled one can turn reporting latency into an apparent performance problem.
Reconcile before changing the business
- Reconcile totals weekly. Compare ad-attributed sales with total ordered revenue, then reconcile orders with settlements through an explicit bridge for timing, fees, refunds and other adjustments. Don't force unlike totals to match or label every unexplained difference organic revenue.
- Choose a fair baseline. Use the same period last year and a comparable seasonal week where the history supports it, while annotating promotions, stockouts and assortment changes. If the connected history doesn't contain that baseline, obtain an appropriate historical source or label the comparison unavailable.
- Review the metric set quarterly. Retire measurements that no one used for a decision and investigate recurring reconciliation exceptions. Keep useful controls even when they aren't performance metrics, including missing-source checks and unresolved processing states.
A working setup gives each recurring question one defined metric, one authoritative source, one date basis and one accountable owner. Supporting inputs can come from several systems, but the reported answer must have a reproducible calculation.
Control check: Another analyst should be able to reproduce the result from the same records without asking which spreadsheet version or interpretation was intended.
Before a budget or listing write, the workflow should preserve the evidence used, preview the proposed change and check the relevant account scope. Afterward, the operator should retain the audit record and verify the resulting state rather than treating a submitted request as the completed business outcome.
How to Read Your Conversion Funnel Step by Step
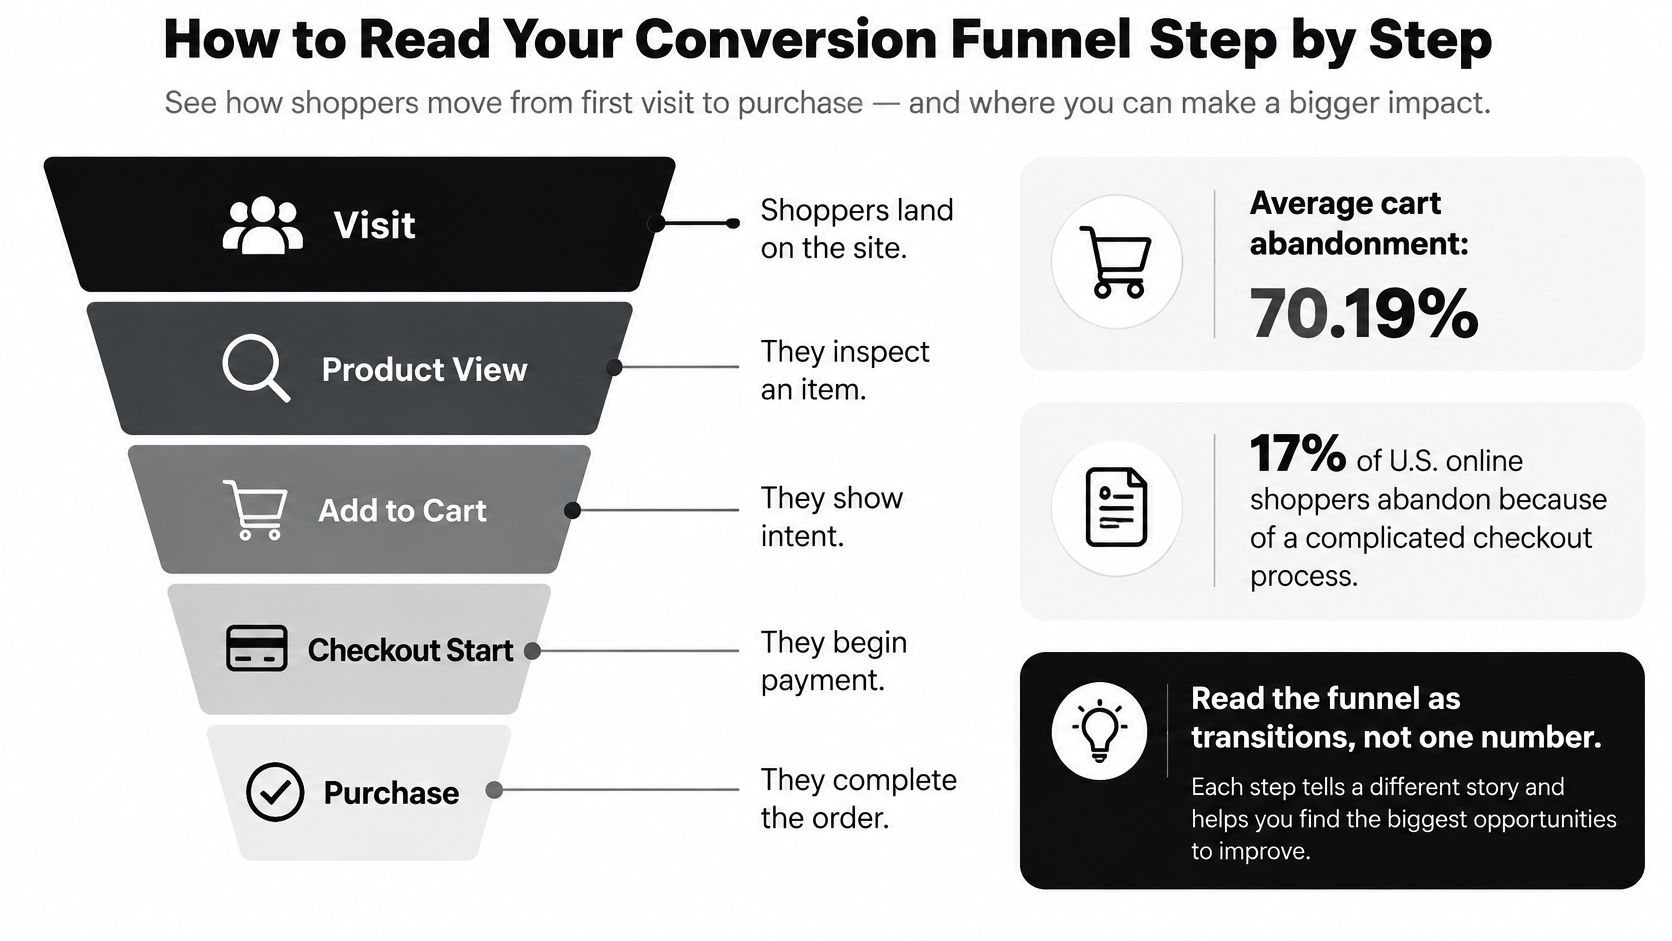
Average cart abandonment is approximately 70.19%, while 17% of U.S. online shoppers abandoned an order because checkout was too long or complicated, according to Baymard's checkout usability benchmark. Baymard reviewed more than 30,000 checkout elements across 344 major U.S. and European ecommerce sites and reports an average U.S. checkout with 23.48 default form elements, against an ideal flow of roughly 12 to 14.
Those aggregates establish a reason to investigate, not the location of a particular store's problem. Analysts need a sequence of transitions and a consistent definition of completion at each step.
Checkout transitions to instrument and segment
| Transition | Event to instrument | Segment by |
|---|---|---|
| Cart creation | Add-to-cart event with product and price | Device, traffic source |
| Checkout initiation | Checkout start event | Device, new versus returning customer |
| Address validation | Address submitted and validation result | Country |
| Shipping-method selection | Shipping option chosen with total landed cost shown | Country, fulfillment promise |
| Payment authorization | Authorization success or failure with error code | Device, country |
| Order completion | Order placed event with order value | Traffic source, new versus returning customer |
Diagnose the transition, then check the economics
Calculate each step's completion rate against the preceding eligible population. Keep device, country, traffic source, customer status and fulfillment promise available across the sequence so analysts can distinguish a local problem from an aggregate change in traffic mix.
For an owned storefront, Excellorix's implementation guidance on how to track purchases with GTM offers a practical starting point for purchase-event tracking. Validate emitted purchase records against the order system before trusting the funnel.
Consider a hypothetical team that removes default fields and exposes total landed cost earlier. Checkout completion improves, but average order value falls and payment errors increase. The team hasn't established success until it checks contribution margin, error rates and whether the same shopper segments improved.
Amazon sellers can't instrument Amazon's own checkout steps. They must interpret the marketplace funnel through available sessions, unit session percentage and ordered product sales, without pretending those fields reveal address validation or payment authorization failures.
The decision rule is to investigate the largest meaningful transition loss after segmentation, then test the proposed fix against retained economic value and errors. A higher final conversion rate alone isn't sufficient.
Which Number Should Guide Your Budget Decisions
Consider a hypothetical campaign with ROAS of 6.0, compared with another at 3.5. The first sells low-margin products with frequent returns; the second sells products that retain more contribution after variable costs. The higher-ROAS campaign can produce weaker profit, or lose money, despite appearing more efficient in the advertising report.
New-to-brand acquisition can also justify evaluating the second campaign differently, but anticipated future value shouldn't be booked as earned profit. The team needs evidence of subsequent purchasing and retained margin.

Attribution allocates credit, not certainty
Google's data-driven attribution documentation describes account-specific analysis of converting and non-converting paths, including interaction timing, device, sequence and creative type. It uses counterfactual estimates to assess how outcomes might differ without a touchpoint.
Last-click reporting can undervalue discovery and assisting interactions. Data-driven credit provides another interpretation, but neither establishes causal lift by itself.
| Measure | Appropriate budget use | What it cannot establish alone |
|---|---|---|
| ROAS or ACOS | Compare attributed advertising efficiency on matched reporting bases | Profitability or incremental demand |
| Attribution-model comparison | Identify allocation hypotheses sensitive to credit assignment | What would happen without advertising |
| Contribution profit | Check retained economic value after variable costs | Whether advertising caused the sale |
Where source records permit, compare last-click, analyst-calculated position-based and data-driven revenue alongside spend, margin, new-customer rate and conversion lag. Don't assume every platform exposes every model, or treat sparse model outputs as precise.
Match reporting maturity to the decision
In the Amazon advertising workflow described here, conversions are attributed over a 14-day window, so yesterday's sales remain incomplete and ACOS can appear artificially high. Attributed sales can continue increasing as Amazon credits purchases to earlier clicks. Operators should preserve the applicable report's attribution definition rather than assume every advertising product uses an identical basis.
For Agent Central's monthly order-volume accounting, orders are distinct Amazon order IDs within a calendar month, using the seller account's reporting timezone, with all supported marketplaces combined into one account total. That billing population shouldn't be confused with campaign-attributed conversions.
- For allocation hypotheses: Use attribution comparisons and inspect how conclusions change with the model.
- For economic viability: Use contribution profit, including refund exposure and the availability of inventory.
- For major budget changes: Use controlled holdouts or time-based tests, accounting for seasonality and carryover.
The strongest campaign isn't necessarily the one receiving the most credit. It's the one for which the team can demonstrate a worthwhile economic outcome under a credible comparison.
What Should You Do First After Reading This Guide?
A credited-sales report cannot by itself tell you whether a campaign deserves more budget. Start with one budget decision that can be answered within a week: which campaigns produce contribution profit after ad spend, product costs, fees, refunds and available inventory are counted?
Make the first pass a checklist:
- Define the result: Contribution profit by campaign and associated product.
- Collect the evidence: Spend, attributed sales, ordered revenue, effective-dated costs and refund records.
- Name the decision owner: The person accountable for accepting the evidence and approving a change.
- Set the action: Increase, reduce, pause or leave the budget unchanged once the evidence is complete.
Agent Central is a hosted MCP server connecting Claude, ChatGPT, OpenClaw, Cursor and other MCP clients to Seller Central and Amazon Ads. One connection covers advertising, inventory, orders, catalog, ranking, finance and fulfillment, with records joined across Amazon's separate reports and APIs. It returns facts, metrics and Amazon's own fields; the user's agent or team decides what happens next.
To set it up, connect Seller Central and Amazon Ads through Amazon's authorization. Then connect the account to Claude through OAuth, or to another MCP client using a Connector URL or scoped API key. Plans are priced by monthly Amazon order volume, with a 14-day free trial that needs no card.
Once connected, test a narrow question such as which active campaigns lose contribution after refunds. Supported changes are previewed by default, protected against duplicate submissions and logged with before-and-after values. Visit agentcentral to connect the accounts and produce an evidence-backed answer before expanding the workflow.
Related Agent Central pages
- Amazon seller data for AI agents
How Agent Central normalizes Amazon seller data before exposing it to AI clients.
- Amazon Ads MCP server
Campaign, keyword, search term, budget, TACOS, and guarded ads-write tools.
- Ads tool reference
Parameter-level docs for Amazon Ads campaign, keyword, search term, budget, and TACOS tools.
- Amazon Seller Central MCP server
Canonical hosted MCP overview for Seller Central, Ads, inventory, catalog, finance, and fulfillment data.
- Finance tool reference
Payment transactions, fee breakdowns, profitability, and settlement economics.
- Amazon seller MCP servers compared
How hosted MCP services compare with official Ads MCP, local repos, connector tools, and automation platforms.
Related reading
- 10 Ecommerce Reporting Software Tools Compared for 2026
Compare ecommerce reporting software by data integrations, reporting depth, automation, and use case, including Amazon Seller Central and Amazon Ads coverage.
- Amazon Competitor Analysis for Operators
Run Amazon competitor analysis with repeatable price, rank, catalog, ad, and review signals while preserving evidence and audit trails.
- What Is Attribution Modeling for Amazon Ads?
Understand Amazon Ads attribution modeling: how credit is assigned, where native reports narrow the view, and why structured data improves analysis.
- Amazon Profit Margins: A Technical Guide for Sellers
Amazon profit margin guide for sellers: gross margin, operating margin, net margin, FBA fees, ad spend, and SKU-level profitability.
Connect Amazon seller data to your AI client.
Agent Central gives Claude, ChatGPT, OpenClaw, Cursor, and other MCP clients structured access to Amazon Ads, Seller Central, inventory, orders, catalog, finance, and fulfillment data.