
Amazon Best Seller Rank Explained for Operators
What Amazon best seller rank actually measures, how it is updated, and how operators can read BSR trends for inventory, pricing, and ads decisions.
The most popular advice about Amazon Best Seller Rank is also the least useful: chase the smallest number possible. A rank can improve during a promotion and then deteriorate when the promotion ends. It can change because competitors sell faster, inventory becomes constrained, or category demand shifts. None of those movements, by itself, proves that a listing is more profitable.
Operators should treat BSR as a fast, relative sales signal. It helps show whether an ASIN is gaining or losing sales velocity inside its category, but it doesn't replace contribution margin, conversion rate, advertising efficiency, inventory coverage, or organic keyword rank. The practical question isn't “How does this ASIN reach number one?” It's “What operational event explains this movement, and does the movement persist?”
Table of Contents
- What Amazon Best Seller Rank Actually Measures
- How BSR Is Calculated and What Amazon Discloses
- Why BSR Moves the Way It Does
- What BSR Changes Tell You About Inventory, Pricing, and Ads
- A Practical Walkthrough of Reading a BSR Trend
- Common Misconceptions That Distort BSR Decisions
- Monitoring BSR With Automated Agents and MCP
- Operator Checklist for Using BSR Without Overreacting
What Amazon Best Seller Rank Actually Measures
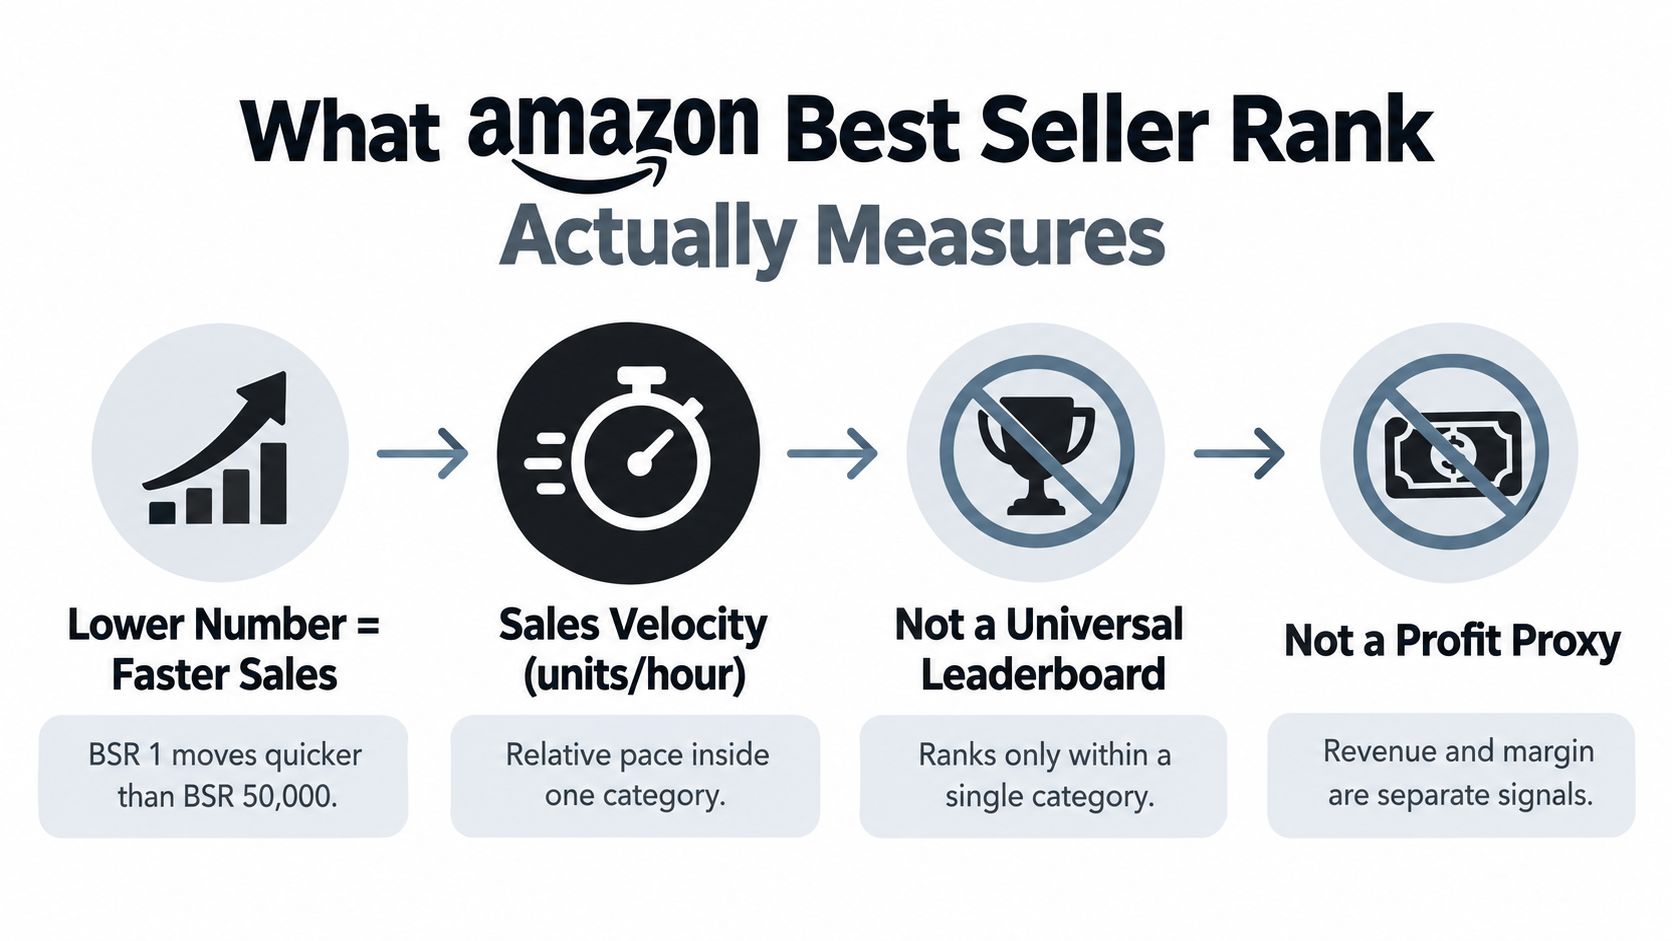
Amazon Best Seller Rank is a category-relative sales metric, not a universal store-wide score. Amazon says BSR reflects Amazon sales, combines recent and historical sales, and compares an item with similar products rather than with every product sold across the store. A rank of #1 means the item is the top seller in that category, while lower numbers indicate stronger recent sales performance within that competitive set. Amazon's explanation of Best Sellers Rank documents that recent sales receive more weight than older sales.
That distinction changes how operators read the metric. An ASIN ranked highly in a narrow subcategory isn't automatically selling more units than an ASIN with a weaker-looking number in a broad, competitive category. A BSR of 5,000 in two different departments doesn't create a valid comparison because each number belongs to a different ranking universe.
The useful interpretation
BSR gives an operator a low-friction read on relative sales velocity. A falling number generally indicates that an ASIN is selling faster than competing products in its category. A rising number indicates that the ASIN's recent sales position has weakened relative to those competitors. The metric doesn't reveal the exact units behind the rank, and Amazon doesn't publish a universal conversion from rank to sales.
That makes BSR suitable for change detection, not precise forecasting. A daily operator can use it to identify a listing that deserves investigation, then verify the cause in orders, inventory, advertising, pricing, and Buy Box data. A rank chart can reveal acceleration or deterioration before a slower business review makes the same pattern obvious.
Practical rule: BSR is a signal to investigate, not a decision to execute.
The metric also has a discovery value. Shoppers and sellers can see a visible proxy for demand even though Amazon doesn't disclose the exact sales volume represented by a rank. Sellers looking for additional context on interpreting category position can consult BSR tips for top sellers, but the operating standard should remain consistent: compare an ASIN with its own historical curve and relevant category peers, not with an unrelated rank.
How BSR Is Calculated and What Amazon Discloses
Amazon discloses the direction of the calculation, but not the complete formula. The public description says BSR is based on sales, refreshed frequently, and influenced by both recent and historical performance. Amazon's help documentation also makes clear that the ranking is relative to similar products in the relevant category, rather than a universal measure of store-wide sales. Amazon's Best Sellers Rank help page is the primary reference for those boundaries.
Independent empirical work adds useful context. A study of Amazon.com found that BSR was updated hourly and driven primarily by sales volume and historical sales data, with recent sales weighted more heavily. That supports reading BSR as a time-decayed demand proxy, rather than as a lifetime-sales score. The Amazon.com BSR study is useful for understanding the observed behavior, but it doesn't turn Amazon's undisclosed formula into a public calculation.
| Element | Amazon disclosure | Operator observation |
|---|---|---|
| Sales basis | BSR reflects Amazon sales | Sales velocity is the primary working interpretation |
| Time weighting | Recent and historical sales both matter | Recent movement can affect the visible rank more quickly |
| Category scope | Products are compared with similar products | Cross-category rank comparisons are invalid |
| Exact formula | Amazon doesn't publish the full formula | Each ASIN needs its own sales-to-rank history |
| Unit conversion | Amazon doesn't disclose exact units behind a rank | BSR can't be used as a precise unit forecast |
What the formula cannot answer
A rank doesn't show revenue, margin, advertising cost, refund exposure, or contribution per unit. It also doesn't tell an operator whether a sales lift came from profitable organic demand or from a discount that reduced contribution. Those questions require separate data sources.
The formula's proprietary nature matters operationally. Teams shouldn't copy a generic rank-to-units chart into a planning model and treat the output as fact. A more defensible workflow records BSR alongside confirmed order and inventory events for each ASIN, then builds an internal interpretation of what specific rank ranges have historically meant for that listing.
Seller Central reporting adds another constraint. Report availability, refresh timing, and the structure of asynchronous reports can make repeated investigation slow, particularly when an operator needs to compare rank with orders, ads, or stock position. The practical differences are outlined in Amazon Seller Central reports, where reporting limitations can be evaluated before a monitoring workflow is designed.
Why BSR Moves the Way It Does
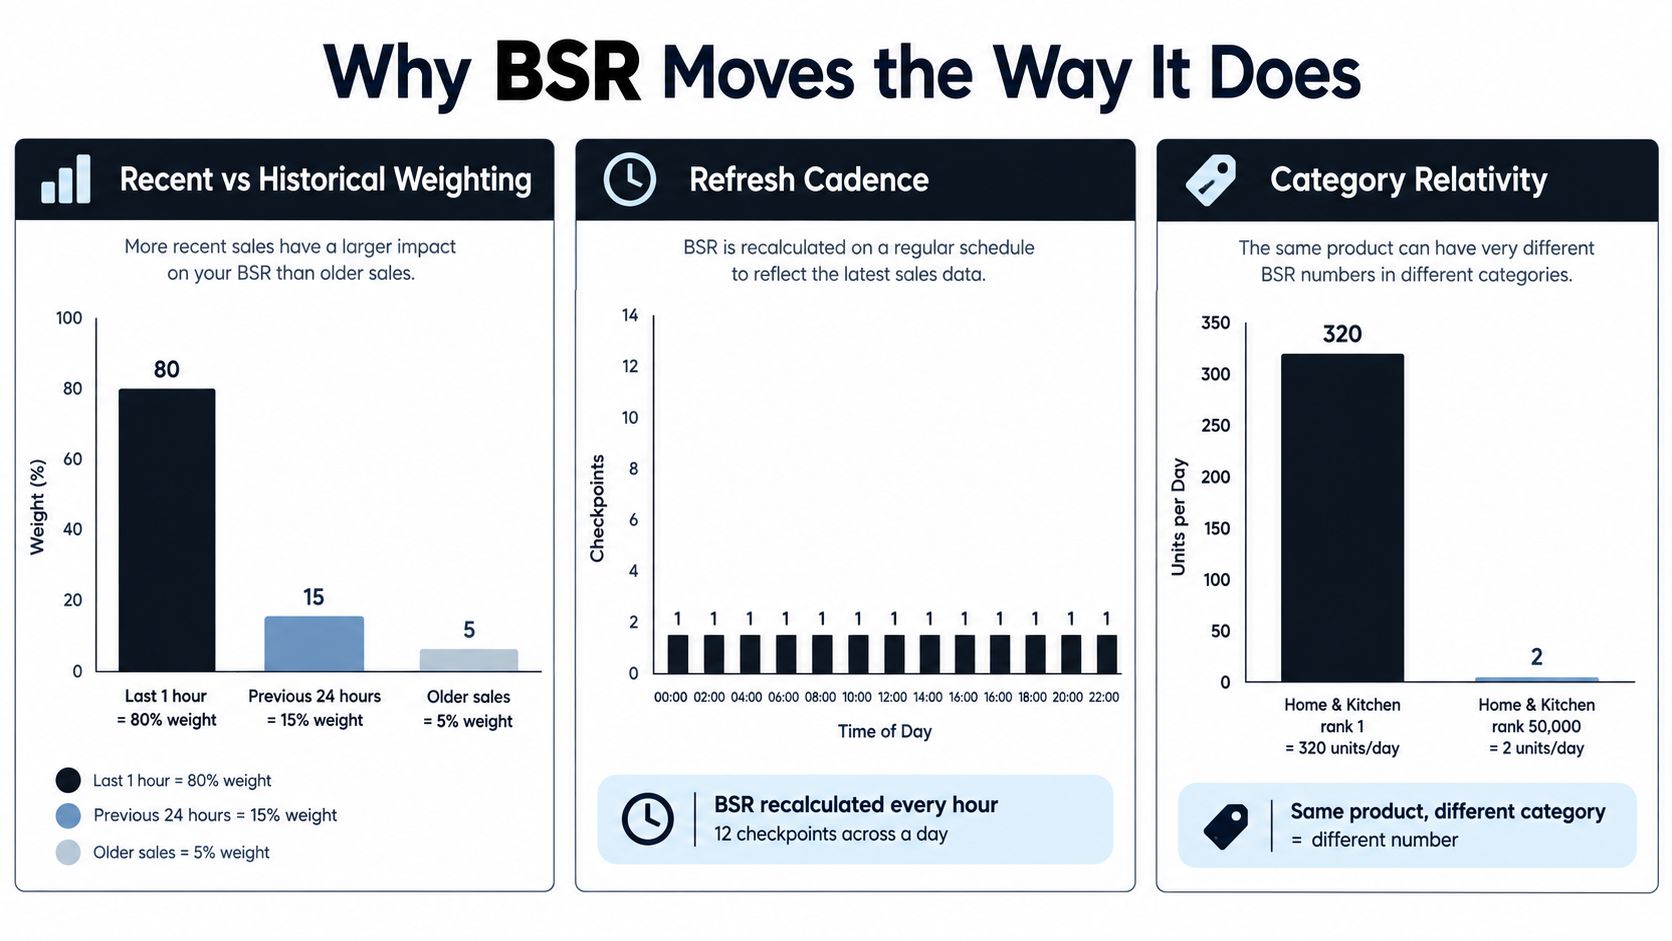
Three forces explain most BSR trajectories: recent sales weighting, refresh timing, and category relativity. Amazon states that recent sales matter more than older sales, so a short period of stronger sell-through can change an ASIN's position without rewriting its entire sales history. The rank may then weaken as that recent performance becomes less influential.
The observed refresh cadence is also important. Amazon describes BSR as updated frequently, while independent seller coverage commonly reports roughly hourly refreshes and a possible lag of approximately one to three hours before a sale appears in rank. WebRetailer's BSR coverage provides that operational context. BSR is therefore useful for near-real-time movement, but it isn't an instant order confirmation.
Category relativity creates the biggest misreads
A rank is meaningful only inside its category context. A product can sell well and still move down if competing products sell faster, as Amazon explains in Seller Central's guidance on relative rank changes. The ASIN's own sales history matters, but the category's current competitive pace matters too.
Parent and subcategory ranks can also tell different stories. A listing may hold a strong position in a narrow subcategory while appearing much weaker in a broad parent category. That isn't necessarily a data error. It reflects two different competitive sets.
Operators should therefore store the category name with every BSR observation. A rank without its category is incomplete data. A time series that changes category labels or mixes parent and subcategory values can produce a confident-looking but invalid conclusion.
What BSR Changes Tell You About Inventory, Pricing, and Ads
A BSR movement becomes useful only after it is connected to an operational driver. The same rank improvement can result from stronger demand, a competitor stockout, a discount, or increased advertising. Each cause produces a different decision.
Inventory
A rising BSR number alongside flat traffic deserves an inventory check before a bid or price change. The listing may have reduced availability, lost the Buy Box, or moved toward a stockout. The first view should be the inventory ledger, including sell-through, inbound units, reserved units, and days of cover.
A stock constraint can make advertising data look worse than it is. Ads may continue generating traffic while the listing has less ability to convert or fulfill demand. If rank stalls while orders and available units point to a supply problem, increasing bids adds pressure to a constrained listing rather than solving demand.
Pricing
Price changes need a margin explanation. A rank improvement after a discount may show faster sales velocity, but it doesn't prove that the promotion improved the business. The operator should compare the movement with the repricing log and contribution margin after product cost, fees, refunds, and advertising.
Competitor availability can create a different pattern. An ASIN may improve because another seller or competing product becomes unavailable. That lift can disappear when the competitor returns. The correct first check is the repricing log and competitive offer history, not an assumption that the product has earned durable organic demand.
Ads
Rising rank with stable ACoS and a weakening organic share can indicate that paid traffic is carrying more of the sales mix. That pattern may represent a ranking improvement, but it can also signal that the account is paying increasingly to maintain volume. The next view should be the Sponsored Products search-term report, together with conversion and organic placement data.
| BSR pattern observed | Most likely operational driver | First metric to verify |
|---|---|---|
| Rank weakens while traffic stays stable | Inventory, Buy Box, or conversion issue | Inventory ledger and Buy Box share |
| Rank improves during a promotion | Discount-driven velocity | Contribution margin and pricing log |
| Rank improves while organic share falls | Paid demand is carrying more volume | Search-term report and TACOS |
| Rank worsens during replenishment delay | Reduced availability | Days of cover and inbound units |
| Rank improves while competitors lose availability | Category competition changed | Competitive offer and stock status |
The conclusion is straightforward: BSR reports the outcome of sales movement, not the cause. Operators who connect it to stock, price, and ads can use it as an early diagnostic. Operators who react to the number alone risk correcting the wrong system.
A Practical Walkthrough of Reading a BSR Trend
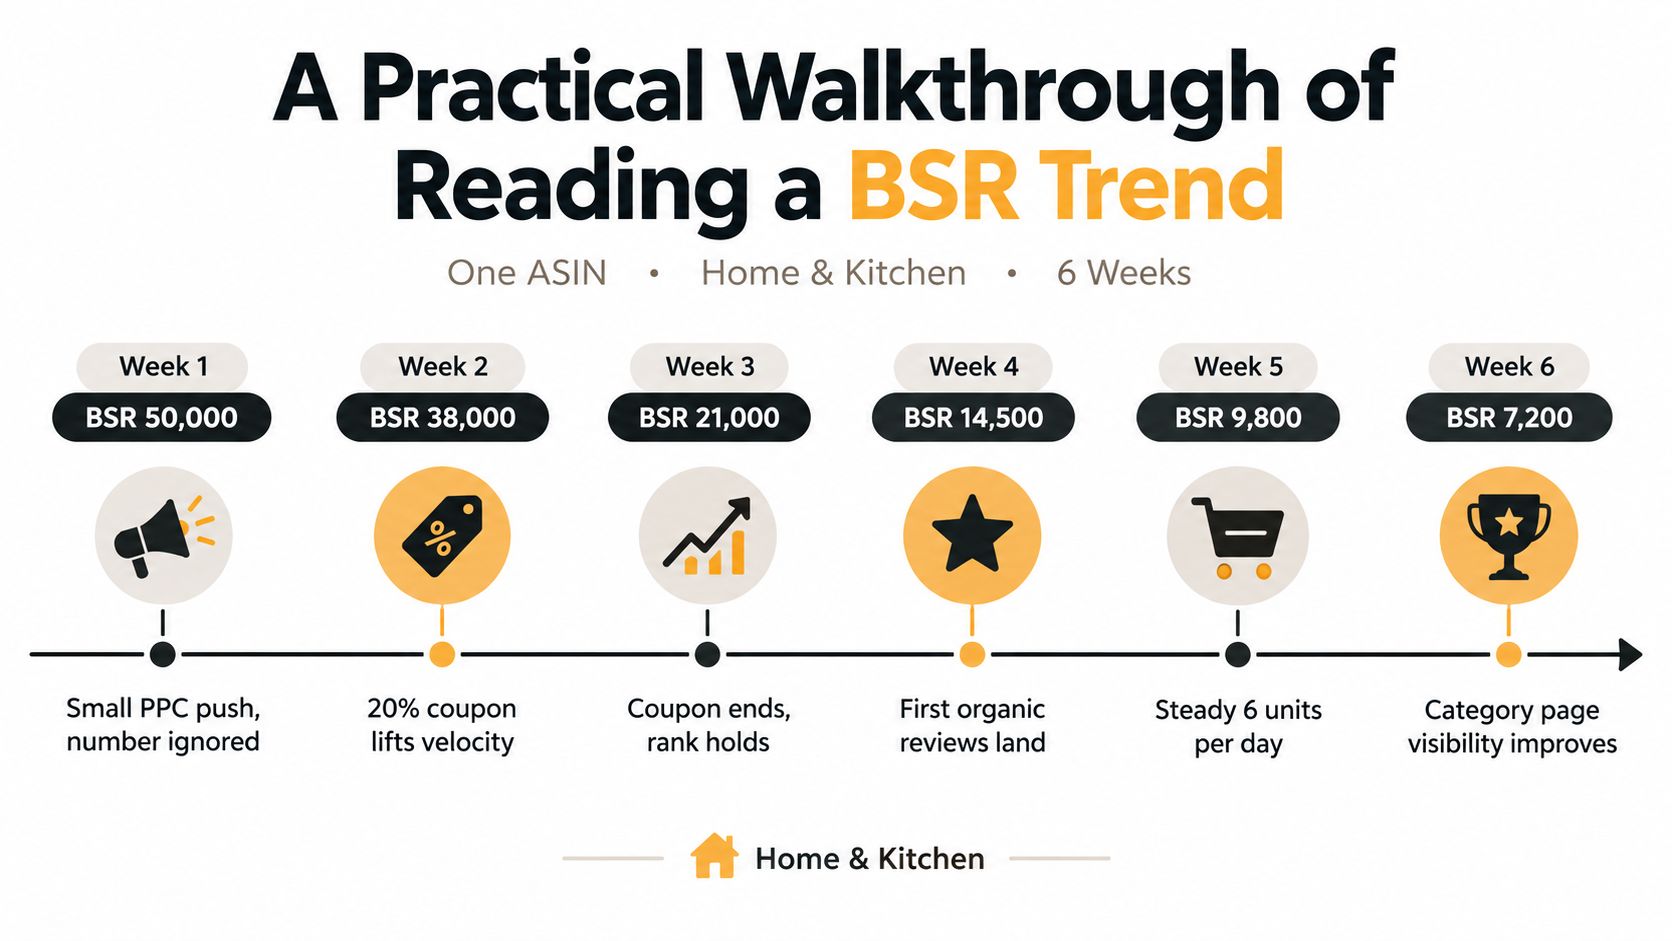
Consider a private-label ASIN in Home & Kitchen moving through a launch period. The exact rank values matter less than the sequence of events. The operator records BSR, orders, advertising spend, coupon status, inventory, and category context in the same timeline.
During the opening period, a small PPC push produces activity, but the rank remains volatile. The seller doesn't treat that as a failure because the listing has limited history and the paid traffic has not yet demonstrated repeatable organic demand.
A coupon then produces a clear rank improvement. The important observation isn't only that the number falls. The operator checks whether review activity, organic share, and conversion behavior also strengthen. If the rank reverses after the coupon ends, the likely conclusion is that the promotion created temporary velocity rather than a durable baseline.
Reading the sequence instead of the point
The next movement comes without additional ad spend because a competitor loses availability. That exposes category relativity. The ASIN's position improves, but the improvement doesn't necessarily represent a change in the listing's own demand. The operator tags the event as a competitive supply change.
Later, inventory begins to thin. Advertising remains steady, but BSR stops improving. That stall is more informative than the earlier promotion because it appears alongside a supply constraint. The seller checks inbound units and days of cover before altering bids or pricing.
After replenishment arrives, the rank resumes its earlier direction. The sequence supports an operational diagnosis: the stall came from inventory pressure rather than a sudden loss of customer interest. Amazon sales data analysis can provide a useful framework for joining sales observations with the surrounding account data.
A practical trend record should include:
- Rank context: ASIN, parent category, subcategory, marketplace, and observation time.
- Demand evidence: Ordered units, conversion rate, organic share, and search visibility.
- Commercial context: Price, coupon state, advertising spend, and TACOS.
- Supply context: Available units, inbound inventory, Buy Box status, and days of cover.
- Event labels: Promotion, competitor change, ad pause, stock constraint, or replenishment.
The lesson is operational: a single BSR point can't distinguish a demand problem from a supply problem. A sequence of synchronized events often can.
Common Misconceptions That Distort BSR Decisions
BSR creates bad decisions when operators ask it to answer questions it was never designed to answer.
The fixed units-per-day fallacy
A rank doesn't equal a fixed number of daily sales. Category size, competitor velocity, price, and conversion efficiency change the relationship between rank and units. A rank should be interpreted against the ASIN's own order history, not against a universal sales chart.
Counter-rule: Use BSR for direction and order data for volume.
Category confusion
A rank in Pet Supplies shouldn't be compared directly with a rank in Books or Home & Kitchen. Amazon defines BSR within relevant categories, so the number carries meaning only alongside its category path.
Counter-rule: Store category and subcategory with every observation.
Treating BSR as profit
A strong rank can coexist with thin contribution margin. A promotion, high ad cost, or expensive fulfillment profile can make a fast-selling ASIN less attractive than a slower product with healthier economics.
Counter-rule: Reconcile rank with contribution margin after fees, refunds, and ad spend.
Hourly panic
Frequent refreshes make BSR look actionable at every observation. A short-term movement can reflect normal competitive noise, reporting lag, or a temporary sales event. Immediate price cuts and bid changes can amplify that noise.
Counter-rule: Escalate persistent shifts, not isolated movements.
Assuming BSR predicts keyword rank
BSR and keyword rank may respond to overlapping commercial outcomes, but they are not the same metric or algorithm. A listing can improve its category sales position without gaining every target keyword, and keyword visibility can change without an equivalent BSR move.
Counter-rule: Monitor organic rank separately.
A rank change is evidence of movement. It isn't evidence of cause.
Monitoring BSR With Automated Agents and MCP
An MCP-backed data layer turns BSR into an operational signal rather than a trophy column. It can expose BSR, orders, inventory, catalog, and advertising fields through structured tool endpoints, allowing an agent to request consistent ASIN and account views without assembling separate Seller Central screens or waiting for delayed reports.
The first useful endpoint is a BSR stream with the ASIN, category, subcategory, rank, and observation time. Parent and child rollups show whether a movement belongs to one child ASIN or reflects a broader catalog pattern. MAP pricing, inventory state, and advertising metrics supply the context needed to classify the change. For the ranking-specific tooling behind this loop, see track Amazon ranking.
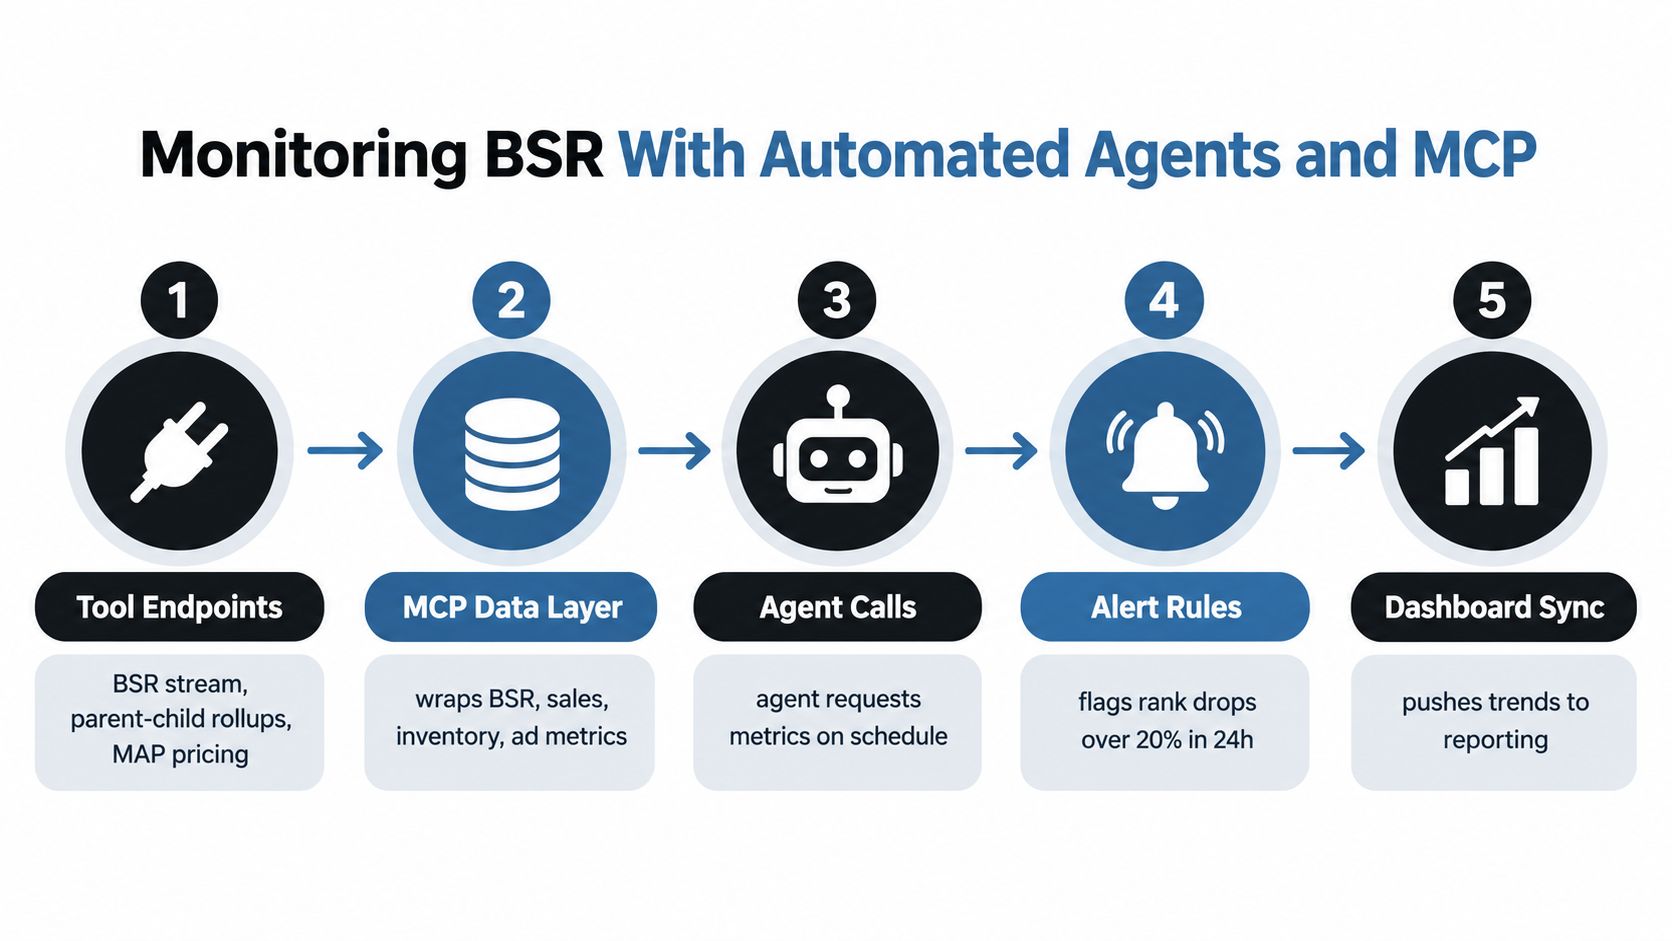
A controlled monitoring loop
A practical agent workflow follows five steps:
- Read: Request BSR and adjacent account fields at a defined cadence.
- Compare: Diff the latest observation against a rolling ASIN baseline.
- Classify: Label the event as a possible replenishment issue, ad fatigue, pricing change, or competitive movement.
- Verify: Cross-check orders, conversion, inventory, and advertising data.
- Escalate: Present a proposed action to the responsible operator or workflow.
Frequent reads can surface a developing stock, advertising, or pricing issue sooner than a periodic Seller Central report. They still do not establish cause on their own.
The data layer should remain separate from the decision layer. A hosted MCP server can return facts, metrics, source-provided fields, and classifications, while the seller's agent or operating process decides whether action is appropriate. That boundary keeps a BSR observation from becoming an unverified bid, price, or replenishment change.
Guardrails should include read-only defaults, scoped API keys, OAuth authorization, isolated datasets, and revocable access. Write tools should use previews, idempotency controls, and audit logs that record the requested change and before-and-after values. Irreversible actions require human approval.
BSR is sampled and delayed relative to transactional data. Agents should verify rank changes against shipped COGS, conversion, orders, and inventory before proposing live changes. A dashboard can surface an anomaly quickly, but BSR alone cannot calculate profit.
Operator Checklist for Using BSR Without Overreacting
A disciplined BSR review starts with context, not the rank column. Daily monitoring should place the metric beside shipped COGS, Sponsored Products spend, available inventory, Buy Box status, and conversion rate. The operator's first question is whether the movement reflects a demand change or a supply constraint.
The weekly review should use trend lines rather than isolated observations. A short-range curve can reveal recent volatility, while a longer curve shows whether the ASIN has established a more stable position. Parent and child views should remain separate so a strong child ASIN doesn't conceal weakness elsewhere in the catalog.
Daily checks
- Confirm availability: Check stock, inbound units, reserved inventory, and days of cover before changing campaigns.
- Check commercial context: Review price, coupons, Buy Box share, and contribution margin.
- Compare paid and organic demand: Inspect Sponsored Products spend, TACOS, conversion, and organic share.
- Tag unusual movement: Record promotions, ad pauses, competitor changes, and replenishment events.
Weekly checks
- Plot the curve: Review BSR history by ASIN, parent, category, and subcategory.
- Compare like with like: Use the same marketplace and category context for every comparison.
- Investigate persistence: Escalate a sustained change rather than a single refresh.
- Reconcile economics: Confirm that rank improvement isn't being purchased at an unacceptable margin.
BSR can't replace contribution margin per unit after fees, refunds, and ad spend. It can't replace inventory planning, keyword rank, conversion analysis, or advertising attribution. It also can't establish that a promotion created durable demand just because the rank improved during the offer.
The strongest operating model treats BSR as a velocity and stability signal. A falling number is encouraging only when sales quality, supply continuity, and economics support it. A rising number is concerning only after the account data identifies what changed and whether the shift is persistent.
agentcentral gives Amazon seller agents structured access to BSR, catalog, orders, inventory, Seller Central, Amazon Ads, finance, and fulfillment data through a hosted MCP server. Sellers and agencies can use its pre-materialized reads, scoped access, OAuth setup, guarded write tools, and audit logs to investigate rank movement without treating BSR as an autonomous decision rule. Visit agentcentral to connect an Amazon account and build a controlled BSR monitoring workflow.
Related Agent Central pages
- Amazon Seller Central MCP server
Canonical hosted MCP overview for Seller Central, Ads, inventory, catalog, finance, and fulfillment data.
- Amazon seller data for AI agents
How Agent Central normalizes Amazon seller data before exposing it to AI clients.
- Connect Seller Central to Claude
Step-by-step path from Amazon OAuth to a Claude connector or MCP config.
- ChatGPT with Amazon seller data
ChatGPT-specific setup path for Amazon seller data through hosted MCP.
- Amazon Ads MCP server
Campaign, keyword, search term, budget, TACOS, and guarded ads-write tools.
- Ads tool reference
Parameter-level docs for Amazon Ads campaign, keyword, search term, budget, and TACOS tools.
Related reading
- What Is Return on Ad Spend? ROAS Guide for Amazon Ads
ROAS = ad-attributed revenue divided by ad spend. Calculate Amazon Ads ROAS, compare it with ACoS/TACoS, and tie it to margin.
- Ads Manager Job Description: A 2026 Amazon Seller Template
Build your 2026 ads manager job description for Amazon sellers, covering responsibilities, KPIs, interview questions, onboarding, and data workflows.
- What Is Amazon PPC? How Sponsored Ads Work
Amazon PPC is a cost-per-click auction for Sponsored Products, Brands, and Display ads. See how targeting, budgets, reporting, and guarded workflows fit.
- Setup Time Reduction for Amazon MCP Integrations
Cut setup time for Amazon Seller Central and Ads MCP integrations with pre-sync, OAuth, scoped keys, and a rollout playbook for agencies.
Connect Amazon seller data to your AI client.
Agent Central gives Claude, ChatGPT, OpenClaw, Cursor, and other MCP clients structured access to Amazon Ads, Seller Central, inventory, orders, catalog, finance, and fulfillment data.